Coordinate plane maker
Coordinate Plane Maker: Plot Points, Draw Shapes, Export as an Image
This free coordinate plane maker lets teachers and students set the axes, plot labelled points, join them into a path or polygon, and reflect, rotate, translate or dilate the shape. Hide the coordinates for a question, show them for the answer key, then export PNG or SVG. It runs in your browser, needs no sign-up, and commercial use is allowed.
- Free, no sign-up
- Plot points, draw shapes
- Reflect, rotate, translate, dilate
- Question and answer key
- Export PNG or SVG
1. Axes
2. Points
| Label | x | y | |
|---|---|---|---|
3. Transformation (optional)
PNG size & background
The PNG stores its print size, so Word and Google Docs insert it at about 10 cm wide. Every PNG and SVG also contains the project, so you can drop it back into the Geometry Editor to keep editing.
Measurements
| Segment | Length | Midpoint | Slope |
|---|---|---|---|
| AB | 3 | (2.5, 2) | 0 |
| BC | 4.243 | (2.5, 3.5) | −1 |
| CA | 3 | (1, 3.5) | undefined (vertical) |
Perimeter: 10.243 · Area: 4.5
How to make a coordinate plane online
Everything updates live in the preview as you type.
- 1
Set the axes
Choose Four quadrants (−10 to 10), −5 to 5, First quadrant (0 to 10) or Custom. Turn the grid, axis numbers and arrowheads on or off and edit the axis labels.
- 2
Add points
Fill in a label, x and y for each row, or paste a whole list such as
A(1,2), B(4,2), C(1,5)into the quick-entry box. - 3
Connect them
Choose None, Path (in order) or Closed shape. A closed shape joins the last point back to the first.
- 4
Choose what to show
Turn on Show coordinates to label points as A(1, 2), or hide them in the question version. Optionally pick a transformation to draw the image as a dashed copy.
- 5
Export
Download a PNG (set the width in cm, 300 DPI, optional transparent background) or an SVG, copy the image, or save the project to re-open later.
What you can do with the coordinate plane maker
A coordinate plane is a flat grid with a horizontal x-axis and a vertical y-axis that cross at the origin, so every point has an ordered pair (x, y). This tool draws the plane at the range and tick spacing you choose, plots your labelled points, and joins them into segments or a polygon. It is made for classroom figures, tests and slides, not for graphing functions.
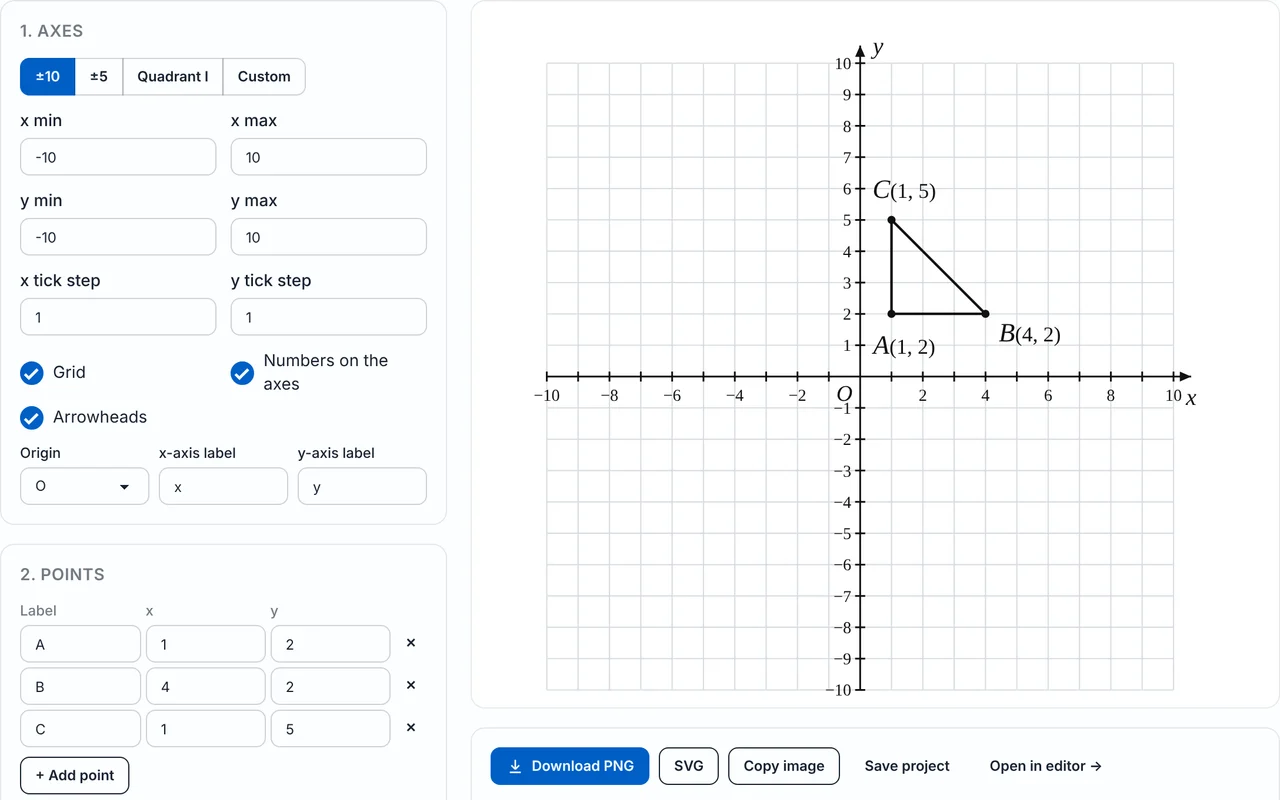
- Axes: four presets or a custom range with your own tick step for x and y, plus grid, axis numbers, arrowheads, the origin label (O, 0 or none) and editable axis labels.
- Points and shapes: a list of labelled points, or one line of quick entry, joined as a path or a closed polygon.
- Question and answer key: hide the coordinates in the question version from the same figure.
- Transformations: reflection, rotation, translation and dilation, with the image coordinates listed.
- Measurements: distance, midpoint and slope between consecutive points, and perimeter and area of a closed shape.
- Export: PNG, SVG, copy image and save project, in Classic, Modern or Exam paper style.
Quadrants, range and tick step
Pick the range that matches your lesson. The First quadrant preset (0 to 10) suits early plotting, and Four quadrants (−10 to 10) or −5 to 5 suit work with negative numbers. Choose Custom to type x min, x max, y min, y max and a separate tick step for each axis.
| Preset | Range | Quadrants shown | Typical use |
|---|---|---|---|
| Four quadrants (default) | −10 to 10 on both axes | I, II, III, IV | Plotting with negative numbers, reflections, rotations |
| −5 to 5 | −5 to 5 on both axes | I, II, III, IV | Larger squares for small shapes and worksheets |
| First quadrant | 0 to 10 on both axes | I only | Plotting positive pairs, early grades |
| Custom | Any x min, x max, y min, y max and tick steps | Your choice | Steps of 2 or 5, wide or tall planes |
Grid, numbers, arrowheads and labels
Turn the grid, the numbers on the axes and the arrowheads on or off independently. Show the origin as O, as 0 or not at all, and rename the axes (the defaults are x and y), for example to “time” and “distance”. Pick Classic, Modern or Exam paper for the overall look.
Plot points and connect them into shapes
Each point is one row with a label, an x value and a y value. Add or remove rows as you need. To enter many points at once, type them in the quick-entry box, for example A(1,2), B(4,2), C(1,5). Turn on Show coordinates and the labels become A(1, 2), B(4, 2) and C(1, 5).
How to plot a point such as (−3, 2)
Start at the origin. The x-coordinate, −3, tells you to move 3 units left; the y-coordinate, 2, tells you to move 2 units up. Mark the point and label it. The first number is always the horizontal move.
Path or closed shape
Path (in order) draws line segments from each point to the next one in the list. Closed shape also joins the last point back to the first, so the points form a polygon. The triangle A(1, 2), B(4, 2), C(1, 5) is a closed shape with a right angle at A. Open this triangle in the tool.
| Quadrant | x | y | Example |
|---|---|---|---|
| I | + | + | (3, 2) |
| II | − | + | (−3, 2) |
| III | − | − | (−3, −2) |
| IV | + | − | (3, −2) |
The quadrants are numbered anticlockwise starting at the upper right. A point that lies on an axis, such as (0, 4), is in no quadrant.
Make a question and an answer key from one figure
Switch on Hide coordinates in the question version. You then export two images from the same figure: the question, where points show only their labels (A, B, C), and the answer key, where they show the labels with coordinates (A(1, 2)). Students read the coordinates off the grid in the question version and check them against the answer key.
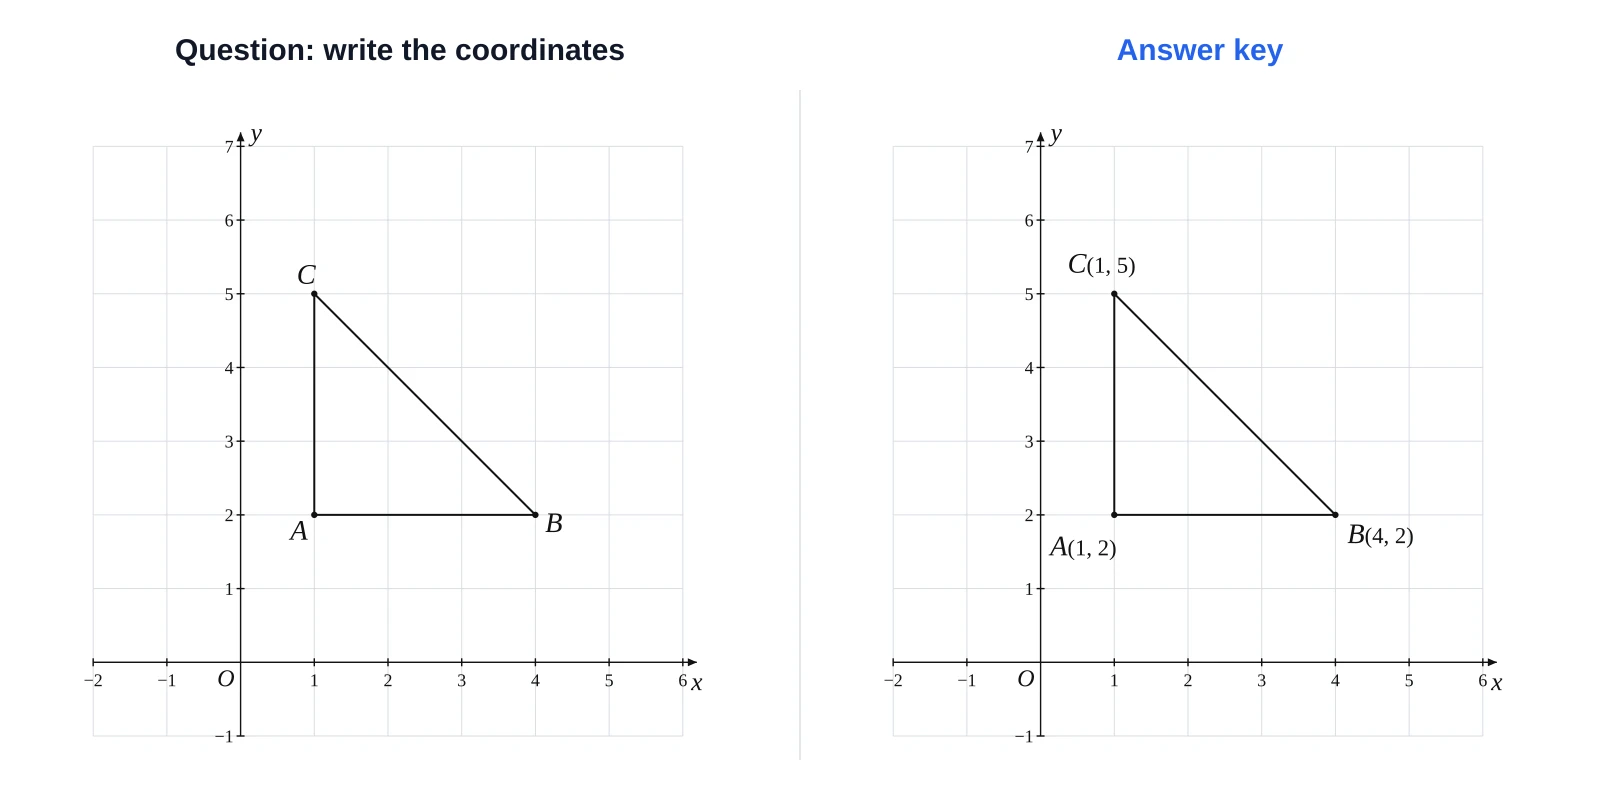
- Ask students to write the coordinates of A, B and C from the question version.
- Give the coordinates in the question text and have students plot them on a printed plane.
- Plot a shape, ask for its reflection, and give the answer key with the dashed image.
Reflections, rotations, translations and dilations
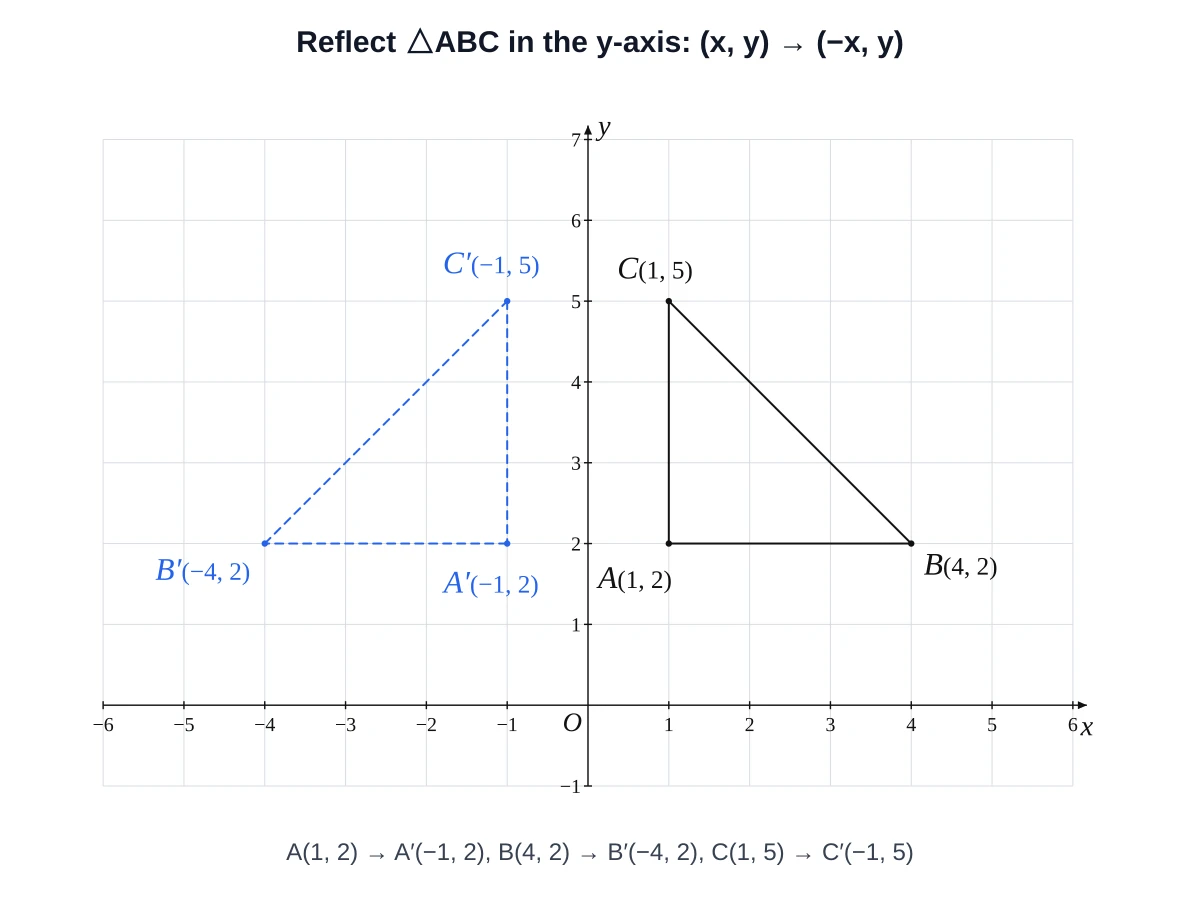
Choose a transformation and the tool draws the image as a dashed copy, with a prime on each label (A′, B′, C′) and the new coordinates listed. The options are: reflect in the x-axis, the y-axis or the line y = x; rotate 90° anticlockwise, 180° or 90° clockwise about the origin; translate by (a, b); and dilate by scale factor k from the origin.
| Transformation | Rule | Example: A(1, 2) goes to |
|---|---|---|
| Reflect in the x-axis | (x, y) → (x, −y) | A′(1, −2) |
| Reflect in the y-axis | (x, y) → (−x, y) | A′(−1, 2) |
| Reflect in the line y = x | (x, y) → (y, x) | A′(2, 1) |
| Rotate 90° anticlockwise about O | (x, y) → (−y, x) | A′(−2, 1) |
| Rotate 180° about O | (x, y) → (−x, −y) | A′(−1, −2) |
| Rotate 90° clockwise about O | (x, y) → (y, −x) | A′(2, −1) |
| Translate by (a, b) | (x, y) → (x + a, y + b) | with (3, −4): A′(4, −2) |
| Dilate by factor k from O | (x, y) → (kx, ky) | with k = 2: A′(2, 4) |
| Transformation | A′ | B′ | C′ |
|---|---|---|---|
| Reflect in the x-axis | (1, −2) | (4, −2) | (1, −5) |
| Reflect in the y-axis | (−1, 2) | (−4, 2) | (−1, 5) |
| Reflect in y = x | (2, 1) | (2, 4) | (5, 1) |
| Rotate 90° anticlockwise | (−2, 1) | (−2, 4) | (−5, 1) |
| Rotate 180° | (−1, −2) | (−4, −2) | (−1, −5) |
| Rotate 90° clockwise | (2, −1) | (2, −4) | (5, −1) |
| Translate by (3, −4) | (4, −2) | (7, −2) | (4, 1) |
| Dilate by 2 from O | (2, 4) | (8, 4) | (2, 10) |
Distance, midpoint, slope, perimeter and area
The measurements panel works out, for each pair of consecutive points, the distance, the midpoint and the slope. For a closed shape it also gives the perimeter and the area, using the shoelace formula.
| Quantity | Formula |
|---|---|
| Distance | d = √((x₂ − x₁)² + (y₂ − y₁)²) |
| Midpoint | ((x₁ + x₂) / 2, (y₁ + y₂) / 2) |
| Slope | m = (y₂ − y₁) / (x₂ − x₁) |
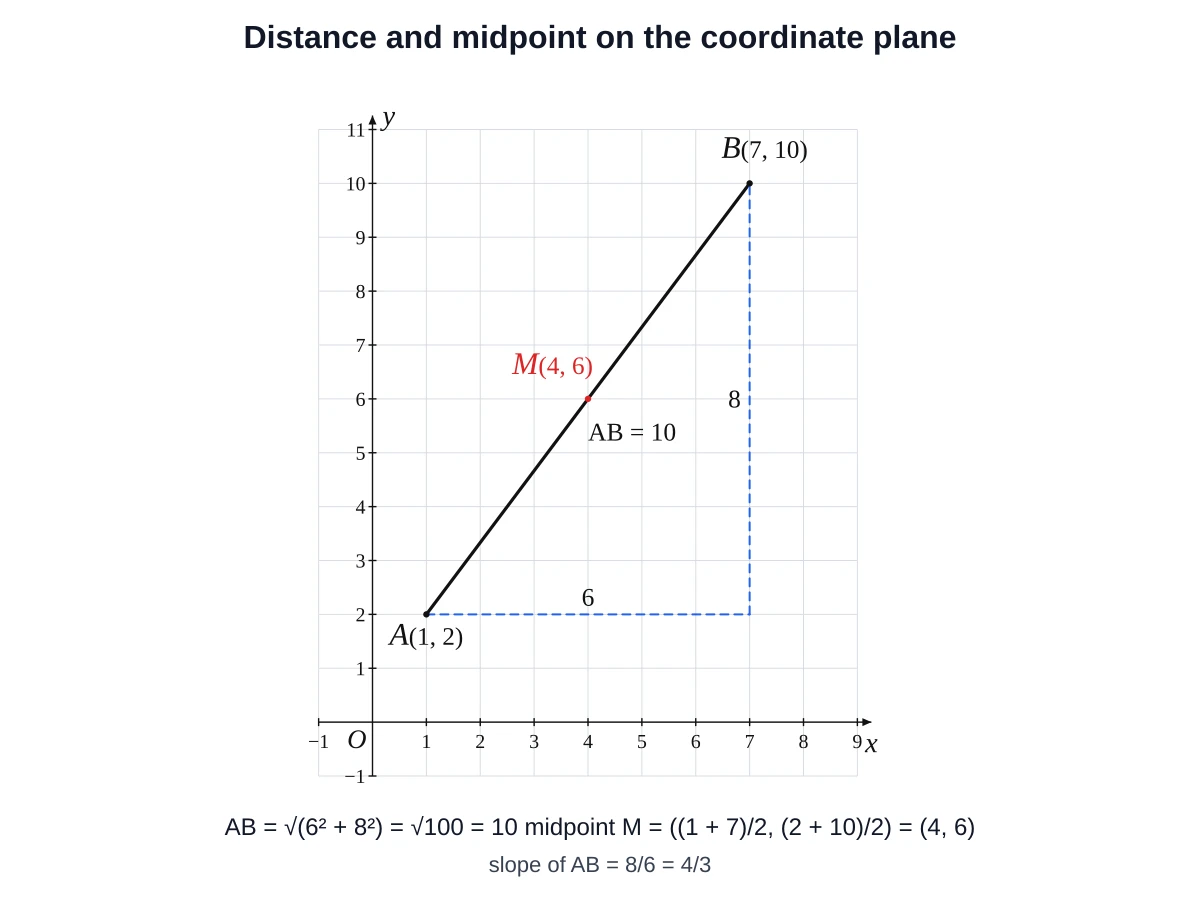
Worked example: A(1, 2) to B(7, 10)
Worked example: the triangle A(1, 2), B(4, 2), C(1, 5)
Export, copy and reuse your figure
| Option | What you get | Good for |
|---|---|---|
| PNG | Raster image, width set in cm, 300 DPI, optional transparent background | Word, Google Docs, Slides, PowerPoint, printed tests |
| SVG | Vector image that stays sharp at any size | Editing in a vector program, large posters, the web |
| Copy image | The figure on your clipboard | Pasting straight into a document or slide |
| Save project | A .json file you can re-open later | Making a new version of a worksheet next term |
| Open in editor | The figure in the free-drawing geometry editor | Adding angles, extra lines or annotations |
Everything runs in your browser and needs no sign-up. The images you export may be used in worksheets, exams, textbooks and products you sell, with no attribution required (see the terms). The Exam paper style uses thin black-and-white lines.
Shareable links
A link can carry a figure. Add ?points=A(1,2),B(4,2),C(1,5)&shape=closed for a closed triangle, &transform=reflect-y for an image (values: reflect-x, reflect-y, reflect-yx, rot90, rot180, rot270) and &range=pm5 for the range (pm10, pm5 or q1-10). Example: the triangle rotated 90° anticlockwise on a −5 to 5 plane.
When to use a different tool
This page is for classroom coordinate-geometry figures: plotted points, polygons, transformations and answer keys. To graph an equation such as y = x² + 1, use the function graph maker, or a dedicated graphing calculator. GeoGebra requires a separate licence for commercial use.
- Need a ready-made sheet to print? See the ready-made printable coordinate planes.
- Need a triangle with exact side lengths or angles before you place it? Use the triangle maker or the polygon maker.
- Need to measure or draw angles? Try the angle maker or the online protractor.
- Need free drawing with points, lines and circles? Use Open in editor to continue in the geometry editor.
Curriculum links
| Curriculum | Where coordinate planes appear |
|---|---|
| US Common Core, grade 5 | 5.G.A.1 and 5.G.A.2: the coordinate system, plotting points in the first quadrant and interpreting them in context |
| US Common Core, grade 6 | 6.NS.C.6: extend the number line and coordinate axes to negative numbers; signs of an ordered pair show its quadrant and reflections across the axes |
| US Common Core, grade 6 | 6.NS.C.8: graph points in all four quadrants and find distances between points with the same first or second coordinate |
| England, Year 6 (KS2) | Describe positions on the full coordinate grid in all four quadrants; translate and reflect simple shapes in the axes |
Coordinate plane maker FAQ
It is a tool that draws the x-axis and y-axis with the range and spacing you choose and lets you plot points and shapes on them. Then you export the figure as an image. This one runs in your browser and is free.
Open the tool, pick a preset (Four quadrants, −5 to 5 or First quadrant) or a custom range, and add your points. Then download a PNG or SVG. No account is needed.
Start at the origin, move x units horizontally (right if positive, left if negative), then y units vertically (up if positive, down if negative). In the tool, type the pair in a row or in the quick-entry box, for example A(3, 2), and it plots and labels the point.
Choose Path (in order) to join the points in the order they are listed, or Closed shape to also join the last point back to the first. A closed shape is a polygon, and the tool then gives its perimeter and area.
Turn on Show coordinates to label points like A(1, 2). Turn on Hide coordinates in the question version to export a question with labels only and an answer key with the coordinates, from the same figure.
Yes. Choose the First quadrant preset (0 to 10 on both axes), or use Custom to set x min and y min to 0 and pick a different maximum or tick step.
Choose the reflection in the transformation options. Reflecting in the y-axis changes (x, y) to (−x, y), and reflecting in the x-axis changes (x, y) to (x, −y). For A(1, 2) that gives A′(−1, 2) and A′(1, −2).
If the points share an x or y value, subtract and take the positive difference. Otherwise use d = √((x₂ − x₁)² + (y₂ − y₁)²). For A(1, 2) and B(7, 10), d = √(6² + 8²) = 10, and the midpoint is (4, 6).
Yes. Use Copy image and paste it into your document, or download a PNG (with an optional transparent background) or an SVG and insert the file.
Yes. Images you export may be used in classroom materials, exams and commercial products, with no attribution required. See the terms for the full wording.
This page makes a custom figure as an image. For ready-made sheets to print, use the printable coordinate plane page.
Last updated · GeometryKit is free to use for classroom and commercial worksheets.