Function graph maker
Function Graph Maker: Plot y = f(x) for Worksheets and Slides
This free function graph maker plots up to five functions y = f(x) on a window and tick step you choose: linear, quadratic, rational, square-root, absolute-value, trig, exponential and log. It marks intercepts, turning points and intersections, and exports a clean PNG or SVG for teachers and students. Runs in your browser, no sign-up, commercial use allowed.
- Free, no sign-up
- Up to 5 functions
- Key points marked
- PNG and SVG export
- Black-and-white worksheet style
1. Functions
Formula syntax
Use x as the variable. + − * / ^, brackets, 2x, |x|, sqrt(x), sin cos tan, asin acos atan, exp(x), ln(x), log(x) (base 10), pi, e.
2. Window
3. Key points & style
PNG size & background
The PNG stores its print size, so Word and Google Docs insert it at about 10 cm wide. Every PNG and SVG also contains the project, so you can drop it back into the Geometry Editor to keep editing.
Key points
| Function | Point | (x, y) |
|---|---|---|
| y = x² − 4x + 3 | x-intercept | (1, 0) |
| y = x² − 4x + 3 | x-intercept | (3, 0) |
| y = x² − 4x + 3 | y-intercept | (0, 3) |
| y = x² − 4x + 3 | Local minimum | (2, −1) |
Found numerically and rounded to 3 decimal places.
Table of values
| x | −2 | −1 | 0 | 1 | 2 | 3 | 4 | 5 | 6 |
|---|---|---|---|---|---|---|---|---|---|
| y | 15 | 8 | 3 | 0 | −1 | 0 | 3 | 8 | 15 |
How to plot a function graph
- 1
Type a function or pick a preset
Type a formula such as x^2 − 4x + 3 (the “y =” is optional), or choose a preset like linear, quadratic, sine or logarithm. An invalid formula shows a message instead of a curve.
- 2
Add more curves
Add up to 5 functions. For each one you can choose solid, dashed or dotted lines, a colour (black by default for worksheets) and whether its equation is written on the curve.
- 3
Set the window and ticks
Enter x min, x max, y min, y max and a tick step for each axis, or start from the Standard, Quadrant I or Trig window. Turn on “π on the x-axis” to label ticks π/2, π, 3π/2 and so on.
- 4
Mark the key points
Show the x-intercepts, y-intercept, turning points and intersections between curves. They are listed in a table and can be marked on the graph with their coordinates.
- 5
Style the figure
Toggle the grid, numbers, arrowheads and axis labels, and pick Classic, Modern or Exam paper style.
- 6
Export
Download a PNG at a width in centimetres (300 DPI, optional transparent background), download an SVG, copy the image, save the project, or open the figure in the editor.
What the function graph maker does
This is a figure maker, not a graphing calculator. It draws clean function graphs for worksheets, exams, slides and documents. Everything is free, needs no sign-up and runs in your browser. Graphs you export can be used in classroom materials and commercial products (see the terms).
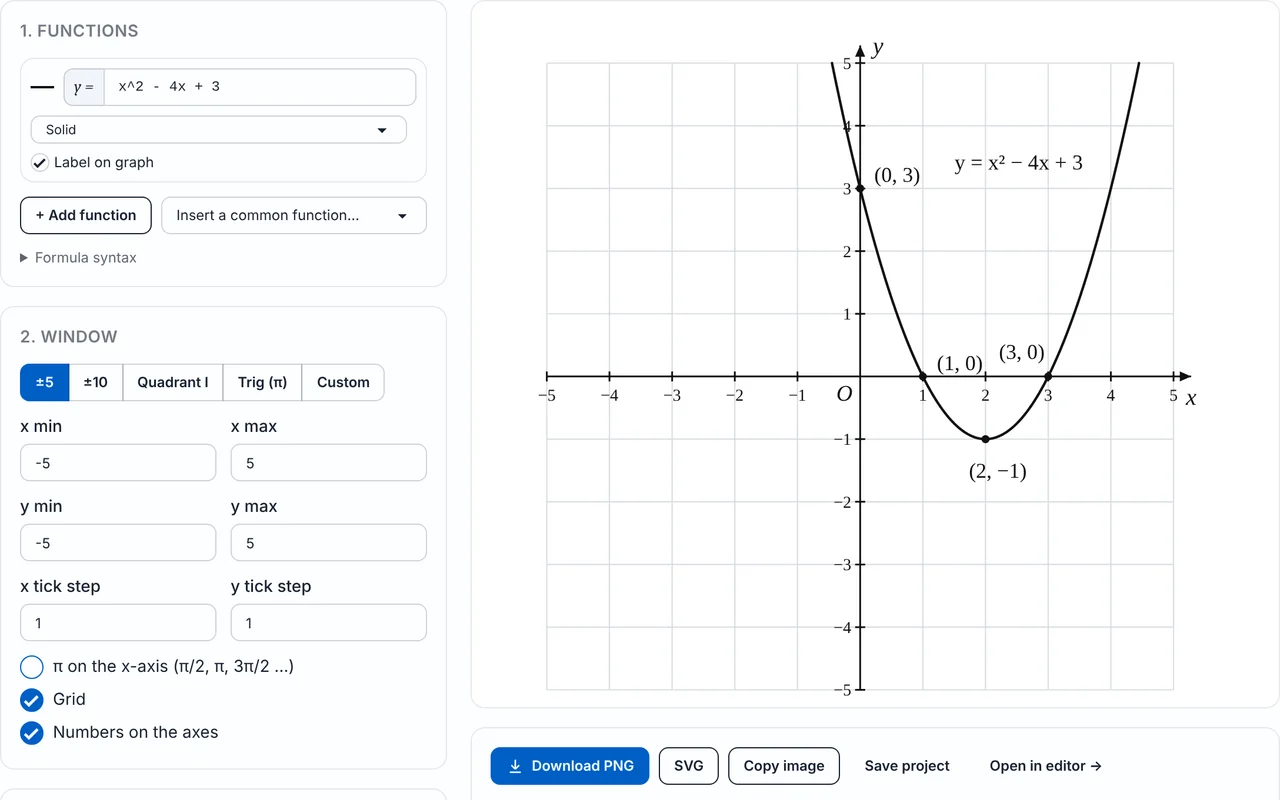
Worksheet style: black and white, light grid
Curves are black by default, with an optional grid and the Exam paper style. This keeps photocopies and printed worksheets sharp. Use dashed or dotted lines to tell several black curves apart.
Paste into Google Docs, Slides or Word
Set the PNG width in centimetres and download at 300 DPI, or choose a transparent background to place the graph over a coloured slide. Copy image puts the graph on your clipboard, and the SVG stays sharp at any size.
Supported functions and syntax
Use + − * / ^ and parentheses. Implicit multiplication works, so 2x, 3(x+1) and 2sin x are all understood. Formulas are parsed safely (nothing is evaluated as code), and a mistake shows a message.
| To get | Type | Notes |
|---|---|---|
| Power | x^2, x^3 | ^ is the exponent |
| Square root, cube root | sqrt(x) or √x, cbrt(x) | sqrt needs x ≥ 0 |
| Absolute value | |x| or abs(x) | V-shaped graph |
| Trig functions | sin, cos, tan | Radians; also sec, csc, cot |
| Inverse trig | asin, acos, atan | |
| Exponential | exp(x) or 2^x | exp(x) is eˣ |
| Logarithms | ln(x), log(x) | ln is natural; log is base 10 |
| Rounding and sign | floor, ceil, round, sign | Step-like graphs |
| Constants | pi or π, e | π ≈ 3.14159, e ≈ 2.71828 |
Presets: linear 2x + 1, quadratic x² − 4x + 3, cubic x³ − 3x, |x|, √x, 1/x, 2ˣ, ln x, sin x, cos x and tan x. Link straight to a graph with ?f=x^2-4x+3, or to two at once with ?f=x^2&f=x+2.
Parent functions and what their graphs look like
A parent function is the simplest member of a family. Knowing its shape, domain and range makes any transformed version easy to sketch.
| Function | Equation | Domain | Range | Key feature |
|---|---|---|---|---|
| Linear | y = x | all reals | all reals | slope 1, through the origin |
| Quadratic | y = x² | all reals | y ≥ 0 | vertex (0, 0), symmetric about the y-axis |
| Cubic | y = x³ | all reals | all reals | odd symmetry, inflection at the origin |
| Square root | y = √x | x ≥ 0 | y ≥ 0 | starts at the origin |
| Absolute value | y = |x| | all reals | y ≥ 0 | V shape, vertex at the origin |
| Reciprocal | y = 1/x | x ≠ 0 | y ≠ 0 | asymptotes x = 0 and y = 0 |
| Exponential | y = 2ˣ (or eˣ) | all reals | y > 0 | passes (0, 1), horizontal asymptote y = 0 |
| Logarithm | y = ln x | x > 0 | all reals | passes (1, 0), vertical asymptote x = 0 |
| Sine, cosine | y = sin x, y = cos x | all reals | [−1, 1] | period 2π |
| Tangent | y = tan x | x ≠ π/2 + nπ | all reals | period π, vertical asymptotes |
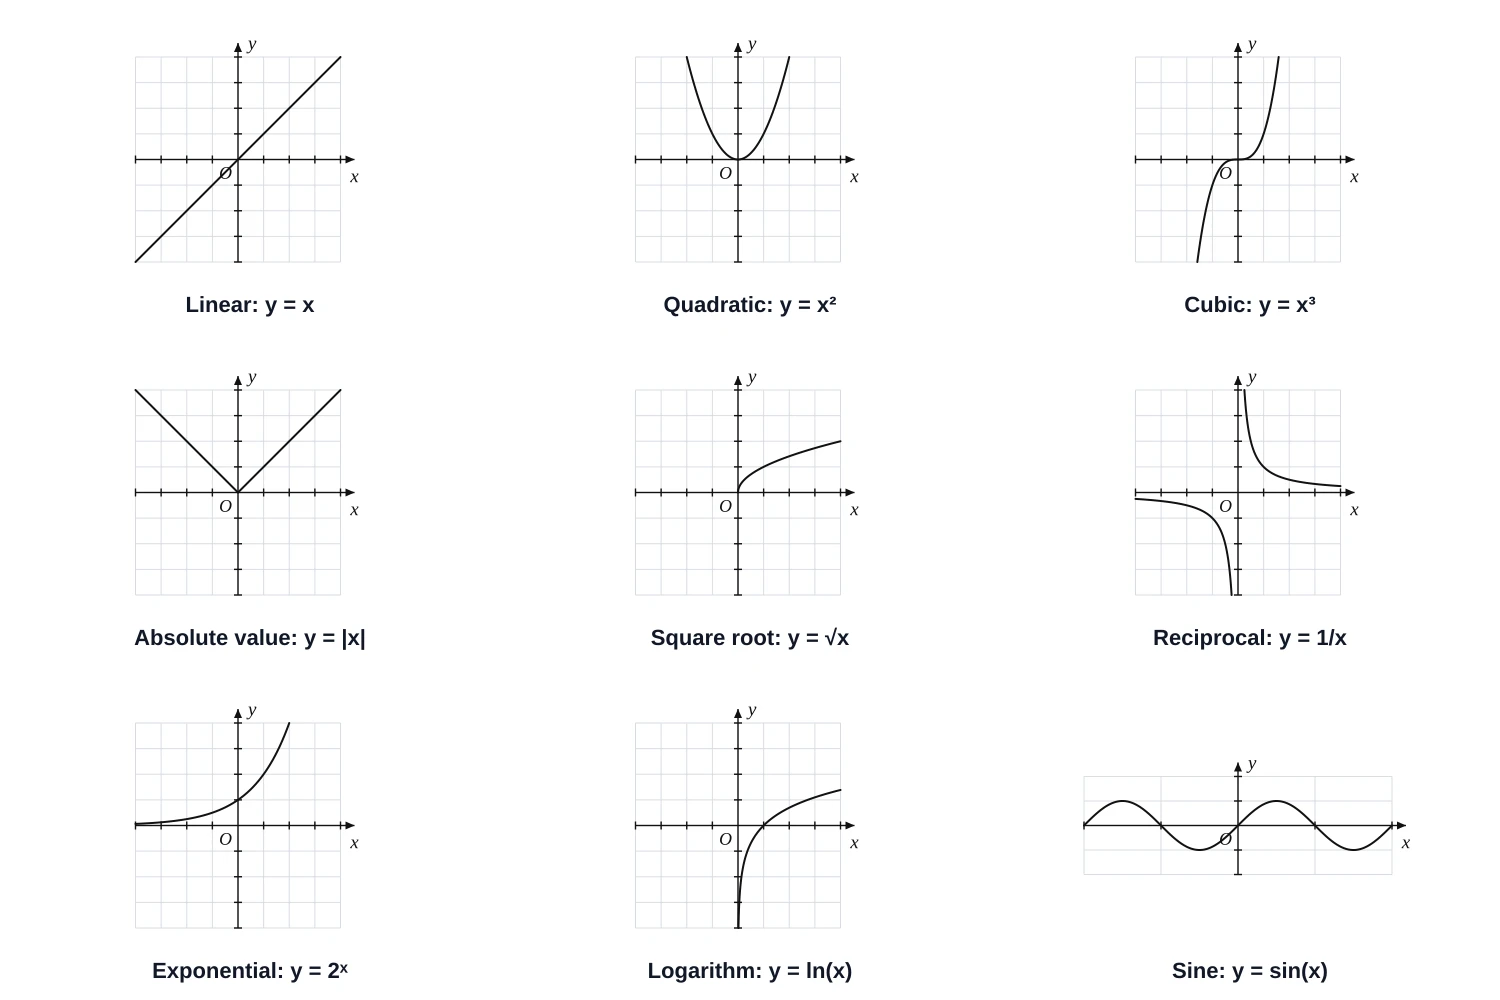
Where a graph has an asymptote, as in 1/x and tan x, the maker breaks the curve there instead of drawing a vertical line across the gap.
How to read a graph: key features
Intercepts
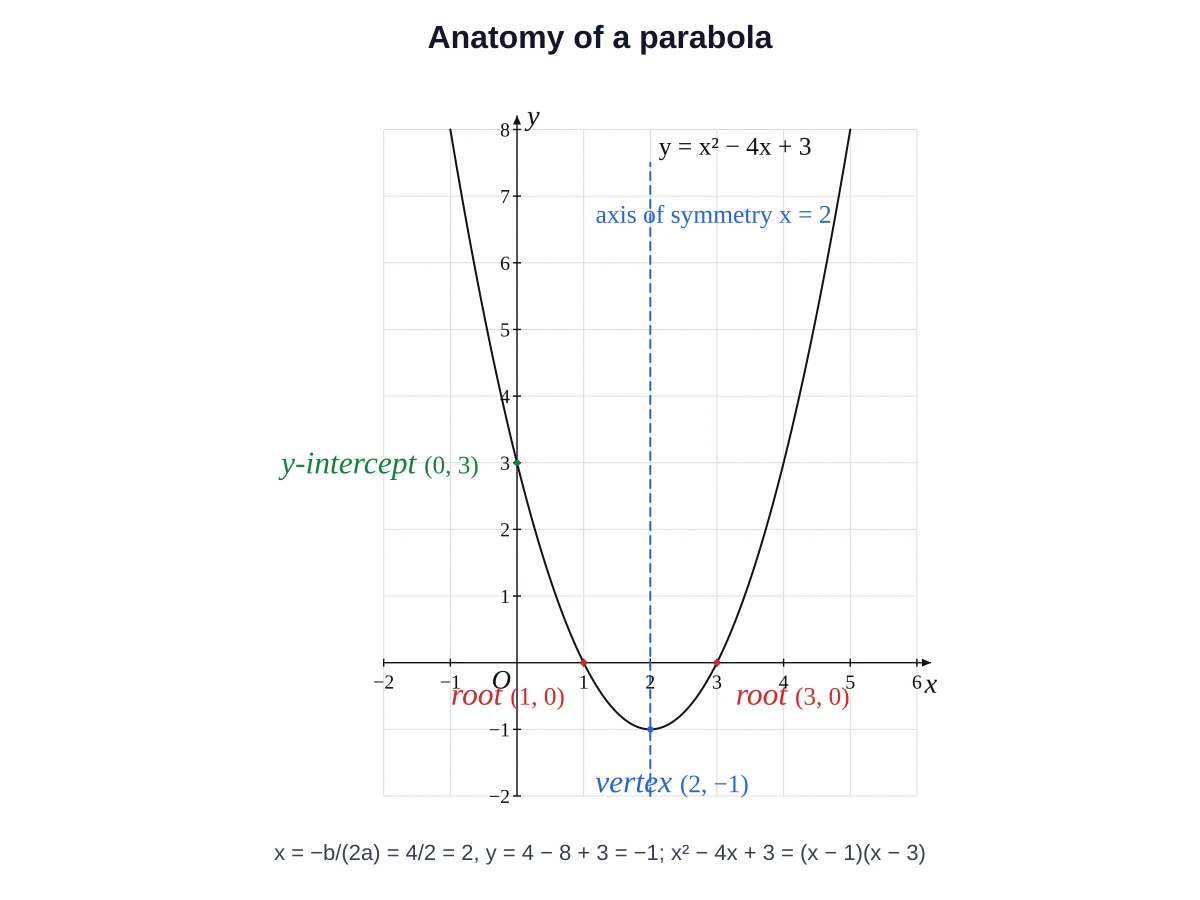
The y-intercept is f(0). The x-intercepts (zeros or roots) are the x-values where f(x) = 0. The maker finds them numerically and lists them in a table.
Vertex and axis of symmetry
For y = ax² + bx + c the axis of symmetry is x = −b/2a, and the vertex lies on it. A turning point is where the graph changes from rising to falling or the reverse.
Vertex x-coordinate: x = −b / (2a)
Asymptotes
A vertical asymptote sits where a denominator is 0, such as x = 0 for 1/x. A horizontal asymptote shows what y approaches as x grows large: y = 0 for 1/x and for 2ˣ on the left.
Domain and range
The domain is every x the function accepts. For √x it is x ≥ 0, and for ln x it is x > 0. The range is every y it produces; the table above lists both for each parent function.
How to choose a graph window and tick step
A good window shows every feature your question is about. The window is set by x min, x max, y min, y max and a tick step on each axis.
- Include all intercepts and the vertex or turning points.
- Widen the window until the shape repeats (trig) or the ends are clear (exponential, log).
- Choose a tick step that gives about 8 to 12 ticks per axis, so labels do not crowd.
- For 1/x and tan x, keep the y range moderate so the branches do not run off the graph.
- For trig graphs use the Trig window (−2π to 2π with π/2 ticks) and switch on π on the x-axis.
- For a first-quadrant problem such as distance against time, use the Quadrant I window.
Transformations: y = a·f(b(x − h)) + k
Four numbers move and stretch any graph. Plot the original and the transformed curve together to see the effect.
| Parameter | Effect | Example on y = x² |
|---|---|---|
| a | vertical stretch by |a|; reflects in the x-axis if a < 0 | 3x² is narrower |
| b | horizontal compression by 1/|b|; reflects in the y-axis if b < 0 | (2x)² is narrower |
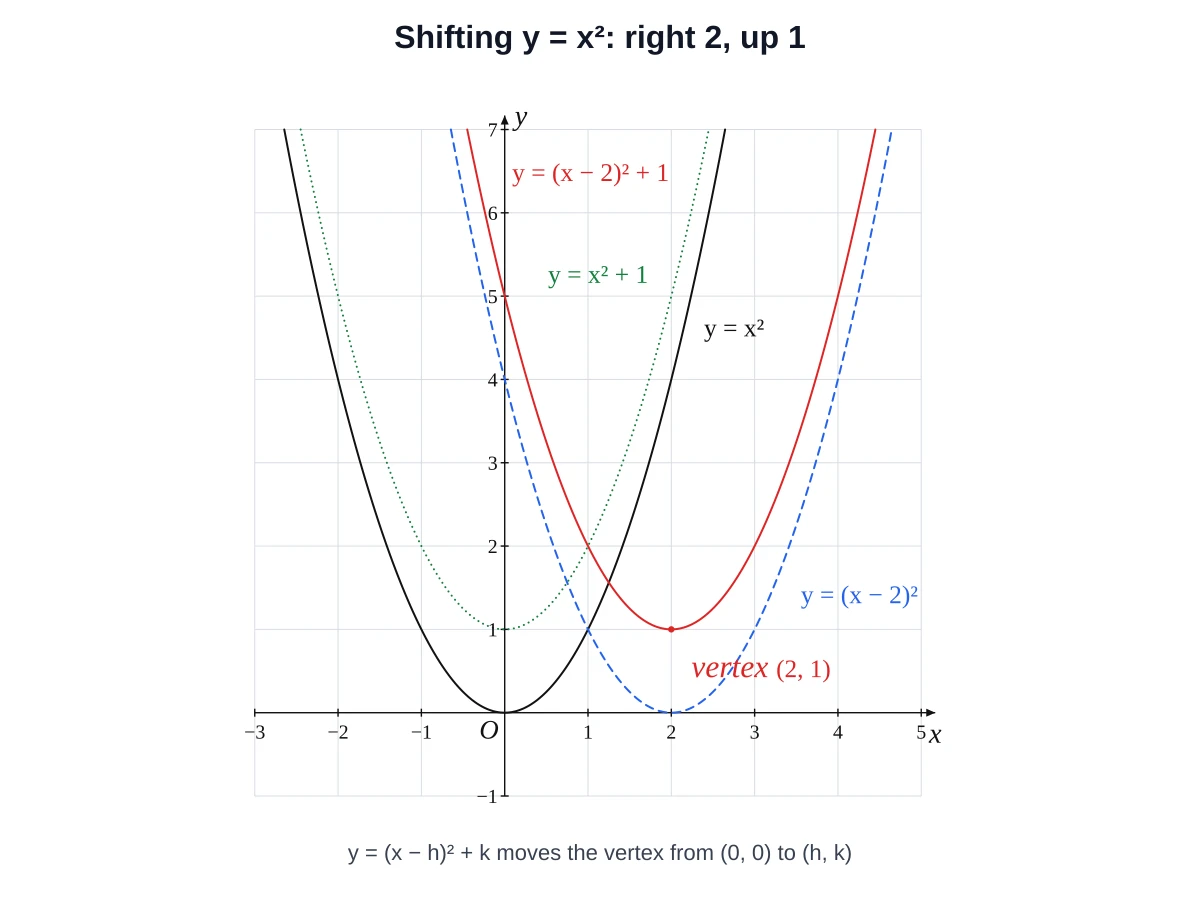
| h | shifts right by h (left if h < 0) | (x − 3)² moves right 3 |
| k | shifts up by k (down if k < 0) | x² + 2 moves up 2 |
For example, y = (x − 2)² + 1 is y = x² moved 2 to the right and 1 up, so its vertex is (2, 1). Plot both curves to compare.
Graphing sine, cosine and tangent
Sine and cosine have period 2π, amplitude 1 and range [−1, 1]. Tangent has period π and vertical asymptotes at x = π/2 + nπ, where cos x = 0.
y = A sin(Bx): amplitude |A|, period 2π / |B|
For y = 2 sin(3x) the amplitude is 2 and the period is 2π/3 ≈ 2.094. Choose the Trig window, which runs from −2π to 2π with π/2 ticks, and open this graph.
Worked examples
Quadratic y = x² − 4x + 3
Intersection of y = x² and y = x + 2
Amplitude and period of y = 2 sin(3x)
Make a graph worksheet
- Answer key: plot the curve with key points and coordinates marked, then export it.
- Student version: turn off the key points and labels, or keep only the grid, so students find the intercepts and vertex themselves.
- Compare curves: plot y = x² and a transformed version with different line styles and ask what changed.
- Table of values: the table for the first function lists y for x from a start value in steps, ready for plotting by hand.
- Plotting points instead? Use the coordinate plane maker for points and lines, or the printable coordinate plane for blank graph paper.
Function graph maker FAQ
Type the function, for example x^2 − 4x + 3, and set the window. The curve is drawn as you type. You can then download it as a PNG or SVG.
Yes, up to five. Each one can have its own line style (solid, dashed or dotted), colour and optional label.
Set f(x) = g(x) and solve. For x² = x + 2 you get x = −1 and x = 2, so the points are (−1, 1) and (2, 4). The maker finds intersections numerically and can mark them on the graph.
Use x = −b/(2a), then substitute that x into the function to get y. For y = x² − 4x + 3 this gives x = 2 and y = −1, so the vertex is (2, −1).
The period is 2π/|b|. For sin(3x) it is 2π/3, about 2.094. The graph of sin x itself has period 2π.
tan x is undefined where cos x = 0, which is x = π/2 + nπ. Those vertical lines are asymptotes. The maker breaks the curve there instead of joining the branches.
Include all intercepts, the vertex and any asymptotes, then widen until the shape repeats or the ends are clear. Pick a tick step that gives about 8 to 12 ticks per axis.
Yes. Curves are black by default, and the Exam paper style keeps lines thin and clean. Download a PNG at your print width in centimetres, or an SVG.
No. It is a figure maker for clean, print-ready images of function graphs. For exploring with sliders, use a graphing calculator, then bring your final function here to export a clean image.
Yes. Graphs you make here can be used in classroom materials, textbooks and commercial products with no attribution. The tool is free and needs no sign-up.
Last updated · GeometryKit is free to use for classroom and commercial worksheets.